Zadanie 3b
Wzorowane na: Chemistry HL Paper 2, May 2022, TZ1, pytanie 3(b). Treść, dane i kontekst są zmienione; sprawdzane umiejętności, format i punktacja jak w oryginale.
Darmowe konto pozwoli wrócić do niego później.
Informacja do zadań 3a-3c.
Methanol is produced industrially from carbon monoxide and hydrogen. The reaction involves the equilibrium:
CO(g) + 2 H2(g) ⇌ CH3OH(g)
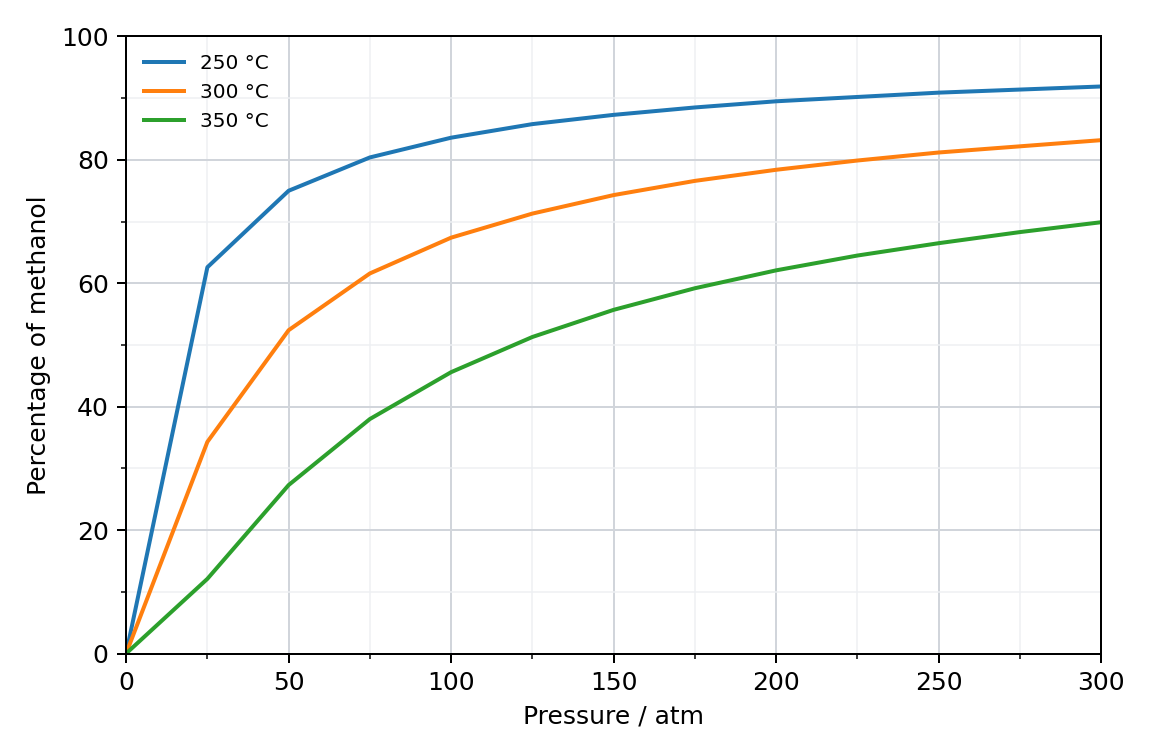
The percentage of methanol in the equilibrium mixture, starting from carbon monoxide and hydrogen in a 1 : 2 mole ratio, under various conditions is shown:
Polecenie
The enthalpy change of the reaction is one factor that influences the position of equilibrium.
(i) Determine the enthalpy change, ΔH, for the production of methanol, in kJ, using bond enthalpies. Use section 12 of the data booklet.
(ii) Outline why a calculation from ΔHf data could give a different value from the one found in (i).
(iii) Demonstrate that your answer to (i) agrees with the way the graph shows the yield changing as the temperature rises.
Sprawdź rozwiązanieUkryj rozwiązanieKlucz i punktacja
Odpowiedź z klucza
(i) bonds broken: C≡O + 2(H−H) / «1 mol ×» 1077 «kJ mol−1» + 2«mol» × 436 «kJ mol−1» / 1077 «kJ» + 872 «kJ» / 1949 «kJ» ✔
bonds formed: 3(C−H) + C−O + O−H / 3«mol» × 414 «kJ mol−1» + 358 «kJ mol−1» + 463 «kJ mol−1» / 1242 «kJ» + 358 «kJ» + 463 «kJ» / 2063 «kJ» ✔
ΔH «= 1949 kJ − 2063 kJ =» −114 «kJ» ✔
(ii) tabulated bond enthalpies are averages over many compounds «so they may not fit these particular molecules» ✔
(iii) increasing the temperature decreases the yield «as the graph shows: the curves for higher temperature lie lower» ✔
the forward reaction is exothermic (ΔH < 0), so a higher temperature shifts the equilibrium in the endothermic / reverse direction ✔
Schemat punktowania
(i) M1: bonds broken; M2: bonds formed; M3: ΔH. Award [2 max] for +114 kJ. (ii) [1]; accept “ΔHf data are exact values for the specific compounds”. (iii) M1: the effect read from the graph; M2: link to the sign of ΔH.