Zadanie 19
Wzorowane na: Chemistry HL Paper 1, May 2023, TZ1, pytanie 19. Treść, dane i kontekst są zmienione; sprawdzane umiejętności, format i punktacja jak w oryginale.
Darmowe konto pozwoli wrócić do niego później.
Polecenie
The graph shows how the concentration of reactant A changes during a reaction. The dashed line is the tangent to the curve at t = 0.
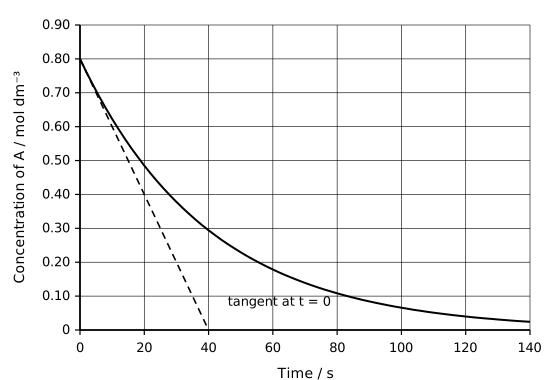
Which calculation gives the initial rate of reaction, in mol dm−3 s−1?
A.
B.
C.
D.
Sprawdź rozwiązanieUkryj rozwiązanieKlucz i punktacja
Odpowiedź z klucza
D ✔
«the initial rate is the magnitude of the gradient of the tangent at t = 0: . The other options are average rates over longer intervals, which are smaller because the curve flattens»
Schemat punktowania
One mark for the correct option.