Zadanie 1a, Paper 1B, maj 2026, TZ1, Chemia IB HL
Wzorowane na: Chemistry HL Paper 1B, May 2026, TZ1, pytanie 1(a). Treść, dane i kontekst są zmienione; sprawdzane umiejętności, format i punktacja jak w oryginale.
Darmowe konto pozwoli wrócić do niego później.
Zadanie
Wspólne informacje do wiązki zadań
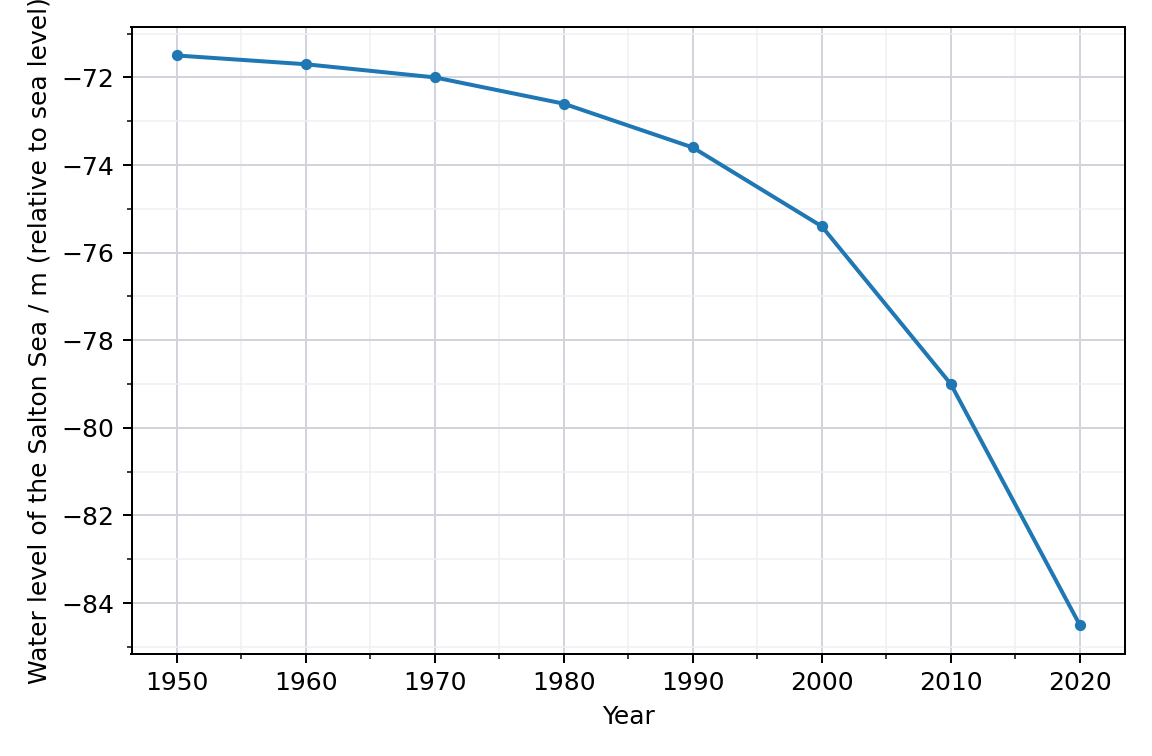
The Salton Sea is a large saline lake in the Colorado Desert, California, USA, whose surface lies below sea level. Its water level has been falling markedly over the last few decades.
Polecenie
(a) The graph shows how the water level of the Salton Sea has changed since 1950. The reference point for the water level is sea level.
 Powiększ
(i) Suggest a reason why the values plotted on the vertical axis are negative.
(ii) Describe the general trend in the rate of change of the water level between 1970 and 2000, supporting your answer with evidence about the gradient of the graph.
(iii) The surface area of the Salton Sea was approximately 900 km2 from 1950 to 1990. Estimate the volume, in m3, of water that evaporated during this time.
(iv) Suggest two environmental factors that could cause the decreasing water level of the Salton Sea.
Korepetytor AI
Nie wiesz, jak ruszyć? Korepetytor zna to zadanie i poprowadzi Cię krok po kroku, bez gotowca.
3 rozmowy · bez karty · Zaloguj się
Sprawdź się
Odpowiedz i oceń, jak poszło. Klucz odsłoń dopiero, gdy masz swoją odpowiedź.
Zanim porównasz z kluczem
Jak poszło Ci z tym zadaniem?
Zaloguj się, żeby zapisać ocenę i wrócić do zadania później.
Pokaż rozwiązanieUkryj rozwiązanieKlucz i punktacja
Odpowiedź z klucza
(i) the water level/surface of the lake is below sea level, «the reference point (datum) of the vertical axis» ✔
(ii) the rate of fall increases «in magnitude»/the rate of change of water level becomes more negative between 1970 and 2000 ✔
the curve gets steeper/the gradient becomes more negative «e.g. gradient near 1970 (using 1960 and 1980) ≈ −0.045 m yr−1, gradient near 2000 (using 1990 and 2010) ≈ −0.27 m yr−1, about six times as steep» ✔
(iii) «height fallen = ∣ − 73.6 − (−71.5)∣ =» 2.1 «m» ✔
«V = 900 × 106 m2 × 2.1 m =» 1.89 × 10⁹ m3 ✔
(iv) Any two of:
less water flows into the lake «rivers or drains diverted for irrigation or urban use» ✔
decreasing rainfall/precipitation «prolonged drought in the catchment» ✔
increasing temperature/global warming «more evaporation» ✔
higher wind speeds ✔
lower atmospheric humidity ✔
Schemat punktowania
(i) [1] for the water level being below sea level (the reference point); accept 'below the datum'. Do not accept only 'the water depth increases'. (ii) M1: the rate of fall increases (in magnitude) / the rate of change becomes more negative; M2: the graph gets steeper / the gradient increases in magnitude; accept any correct mathematical treatment using values read from the graph. (iii) M1: height change of about 2.1 m (accept 2.0-2.2 m; do not penalize a missing negative sign); M2: volume of 1.89 x 10^9 m3 (accept 1.8 x 10^9 to 2.0 x 10^9 m3), ECF from M1. (iv) [1] each for two distinct environmental causes from the list; apply the list principle, so two phrasings of the same idea (e.g. 'less rain' and 'drought') score once only. 'Industrial reasons' is not accepted unless linked to an environmental impact; accept 'climate change' or 'greenhouse effect' for global warming.
Komentarz. An answer to the first sub-part that says only 'the water depth increases' earns nothing.