Zadanie 29
Wzorowane na: Chemistry SL Paper 1, May 2023, TZ2, pytanie 29. Treść, dane i kontekst są zmienione; sprawdzane umiejętności, format i punktacja jak w oryginale.
Darmowe konto pozwoli wrócić do niego później.
Polecenie
The graph shows how the concentration of dinitrogen pentaoxide, N2O5, changes with time during its decomposition at constant temperature.
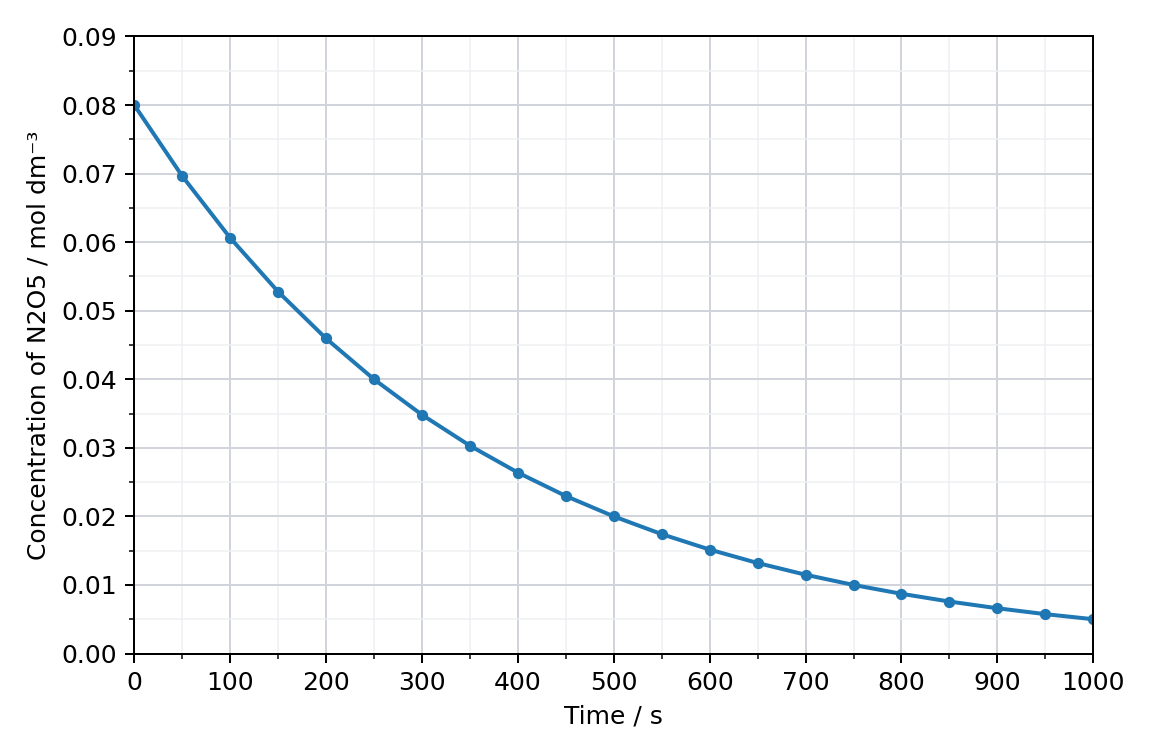
What is the average rate of reaction, expressed as the rate of decrease in the concentration of N2O5, over the first 500 s?
A. 1.2 × 10⁻³ mol dm−3 s−1
B. 1.6 × 10⁻⁴ mol dm−3 s−1
C. 1.2 × 10⁻⁴ mol dm−3 s−1
D. 4.0 × 10⁻⁵ mol dm−3 s−1
Sprawdź rozwiązanieUkryj rozwiązanieKlucz i punktacja
Odpowiedź z klucza
C ✔
«from the graph the concentration falls from 0.080 to 0.020 mol dm−3 in 500 s, so the average rate = (0.080 − 0.020)/500 = 1.2 × 10⁻⁴ mol dm−3 s−1; B uses the initial concentration only, and D uses the final concentration only»
Schemat punktowania
One mark for the correct option.