Zadanie 1e, Paper 2, maj 2023, TZ1, Biologia IB SL
Wzorowane na: Biology SL Paper 2, May 2023, TZ1, pytanie 1(e). Treść, dane i kontekst są zmienione; sprawdzane umiejętności, format i punktacja jak w oryginale.
Darmowe konto pozwoli wrócić do niego później.
Zadanie
Wspólne informacje do wiązki zadań
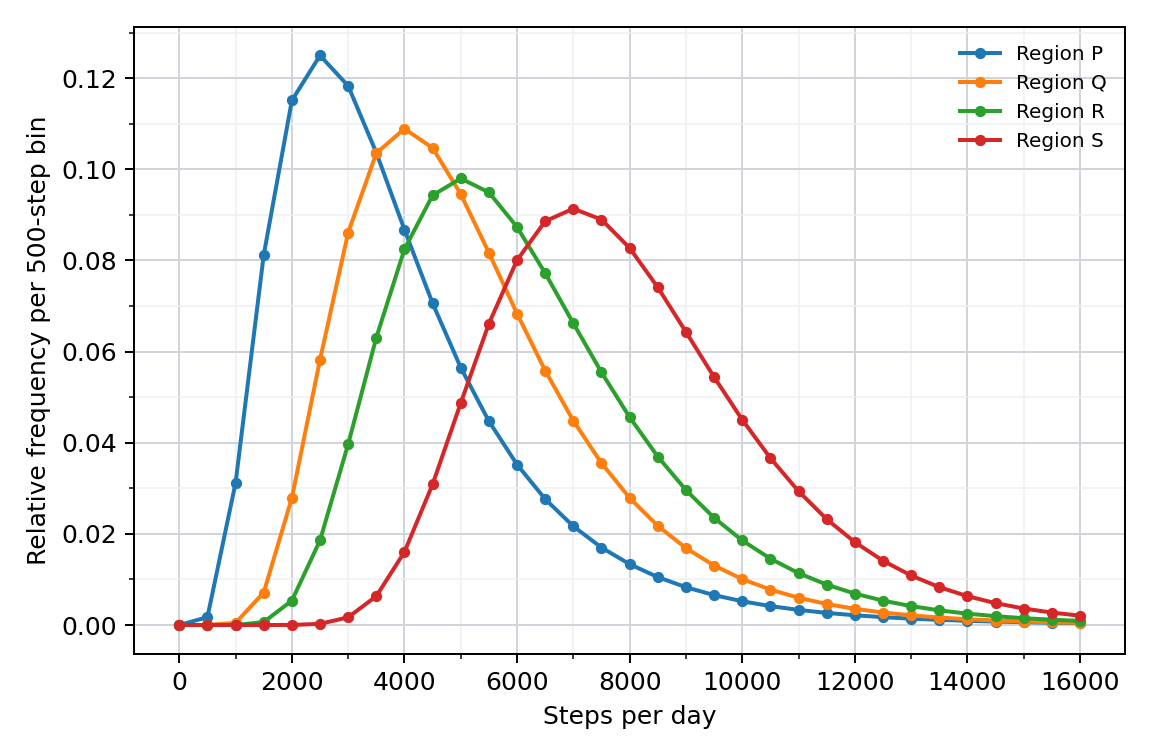
The following are synthetic data for a hypothetical population study; they do not describe any real country. Wearable devices record daily step counts. The first graph compares four regions.
 Powiększ
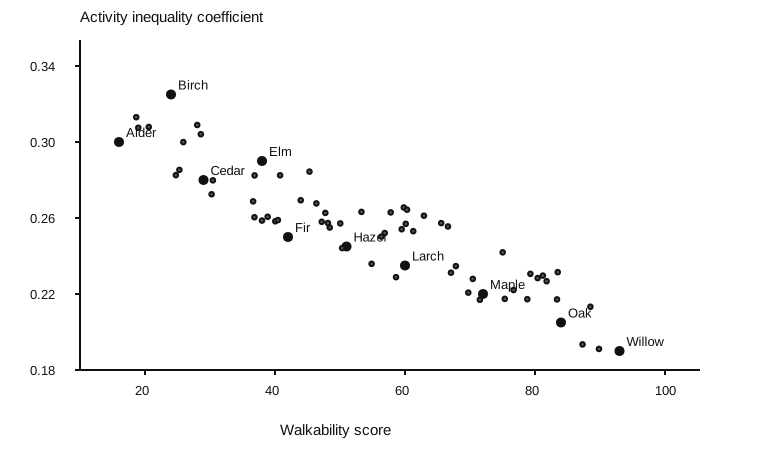
A walkability score measures how easily residents can walk to destinations, considering connected paths, crossings and travel distances. An activity inequality coefficient measures differences in step counts among residents; zero would mean everyone took the same number of steps. Sixty-nine invented cities are compared; ten examples are named.
 Powiększ
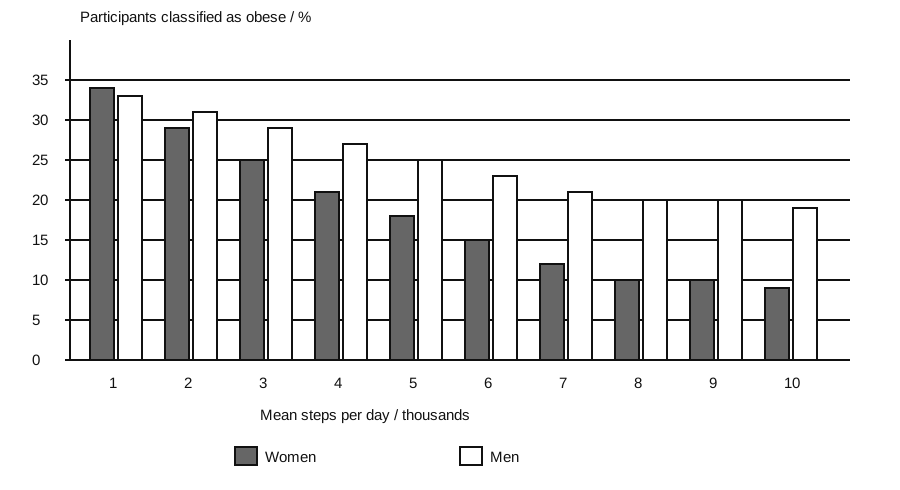
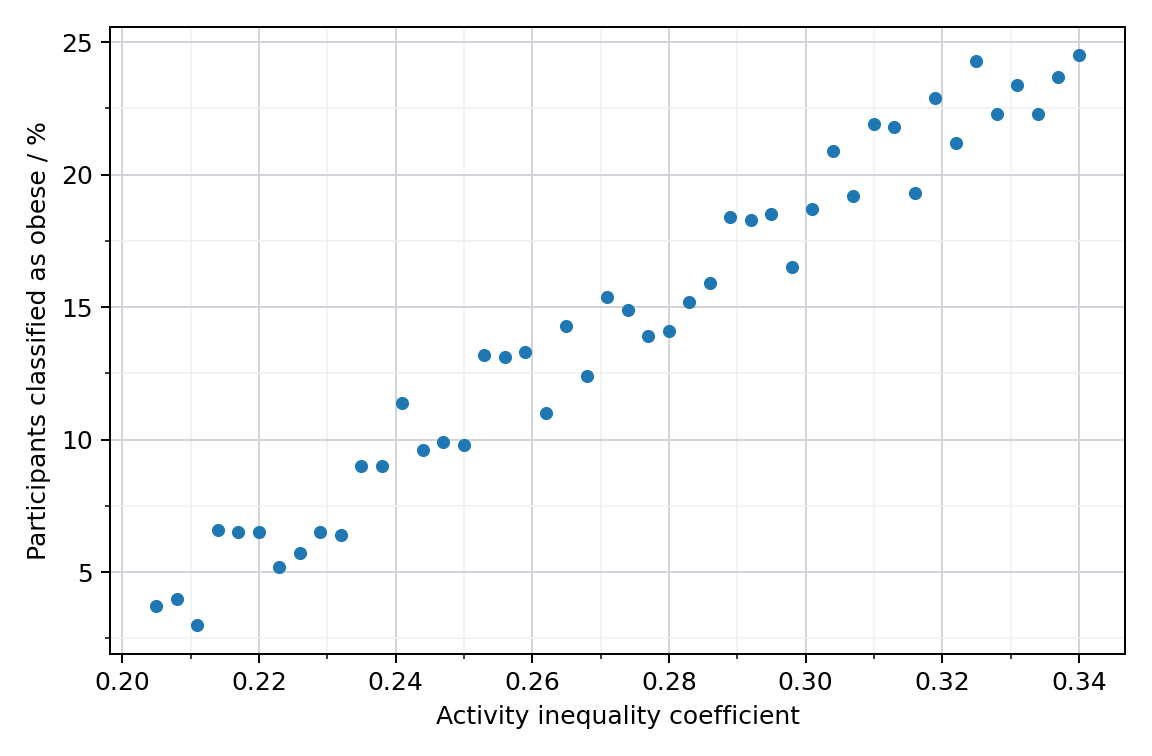
The study also records the proportion classified as obese using one consistent threshold. No calculation of body mass index is required. The grouped chart compares step-count categories, and the final scatterplot compares 46 regions.
 Powiększ
 Powiększ
Polecenie
Compare and contrast the obesity-prevalence patterns for women and men.
Korepetytor AI
Nie wiesz, jak ruszyć? Korepetytor zna to zadanie i poprowadzi Cię krok po kroku, bez gotowca.
3 rozmowy · bez karty · Zaloguj się
Sprawdź się
Odpowiedz i oceń, jak poszło. Klucz odsłoń dopiero, gdy masz swoją odpowiedź.
Jak poszło Ci z tym zadaniem?
Wybierz ocenę: zapamięta ją ta przeglądarka, a z darmowym kontem zobaczysz ją na każdym urządzeniu.
Pokaż rozwiązanieUkryj rozwiązanieKlucz i punktacja
Odpowiedź z klucza
Similarity: prevalence declines as steps increase in both groups OR levels change little above about 8000 steps OR the values are similar in the lowest category. ✔
Difference: the decrease across categories is larger for women OR men have greater prevalence except in the lowest category OR women have a slightly higher value in the lowest category. ✔
Schemat punktowania
Award 1 similarity and 1 difference. Do not interpret observational data as proof of a causal effect.