Zadanie 15
Wzorowane na: Chemistry SL Paper 1, November 2024, pytanie 15. Treść, dane i kontekst są zmienione; sprawdzane umiejętności, format i punktacja jak w oryginale.
Darmowe konto pozwoli wrócić do niego później.
Polecenie
Two samples of the same gas, at temperatures T1 and T2 where T2 > T1, have the Maxwell–Boltzmann distributions of kinetic energy shown. Which diagram is correct?
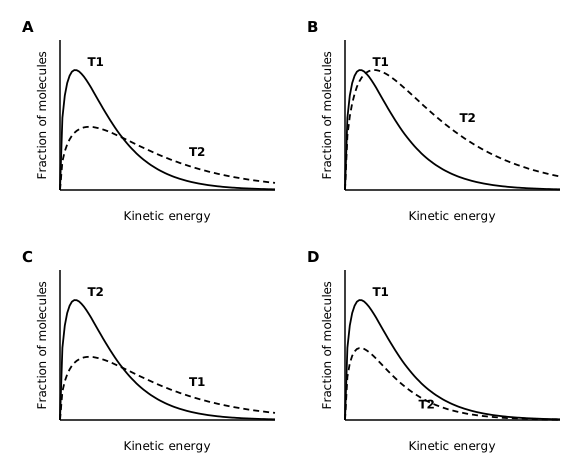
A. Diagram A
B. Diagram B
C. Diagram C
D. Diagram D
Sprawdź rozwiązanieUkryj rozwiązanieKlucz i punktacja
Odpowiedź z klucza
A ✔
«at the higher temperature the peak moves to a higher kinetic energy and becomes lower and broader, because the area under each curve (the total number of molecules) is the same and more molecules have high energies; only diagram A shows this for T2 (in B the T2 curve is as high as the T1 curve and also broader, so it encloses a larger area; in C the labels are swapped; in D the peak does not move)»
Schemat punktowania
One mark for the correct option.