Zadanie 7b, Paper 1, listopad 2023, TZ2, Matematyka AA IB SL
Wzorowane na: Matematyka AA IB SL — listopad 2023, TZ2, Paper 1 (zadania wzorowane), pytanie 7(b). Treść, dane i kontekst są zmienione; sprawdzane umiejętności, format i punktacja jak w oryginale.
Darmowe konto pozwoli wrócić do niego później.
Zadanie
Wspólne informacje do wiązki zadań
A laboratory processed 20000 specimens over 50 working days. Its daily capacity was 600 specimens. The daily counts n are grouped below. For a handling audit, staff will inspect 10% of arriving specimens. Specimens are either refrigerated or ambient-temperature; the proportions in these categories are known.
| Daily count n | Days |
|---|---|
| 0<n≤150 | 4 |
| 150<n≤300 | p |
| 300<n≤450 | 14 |
| 450<n≤600 | 20 |
Polecenie
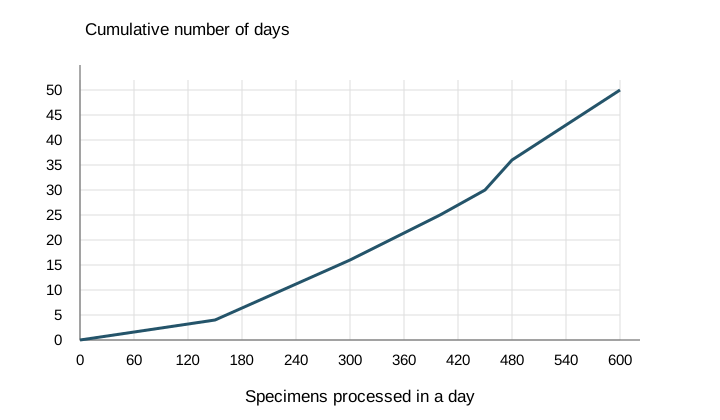
Use the cumulative graph to estimate (i) the median daily count; (ii) the number of days when at least 80% of capacity was used.
 Powiększ
Korepetytor
Nie wiesz, jak ruszyć? Korepetytor zna to zadanie i poprowadzi Cię krok po kroku, bez gotowca.
3 rozmowy · bez karty · Zaloguj się
Sprawdź się
Jak poszło?
Pokaż rozwiązanieUkryj rozwiązanie
Odpowiedź z klucza
(i) The median is at cumulative count 25, giving about 400 specimens. (ii) 80% of 600 is 480. The curve gives about 36 days below this threshold, so about 50−36=14 days met or exceeded it. Boundary ties cannot be resolved from the interpolated display; this is an estimate.
Schemat punktowania
(i) A1:400 specimens, accepting 390–410. (ii) A1:threshold 480. A1:cumulative count 36, accepting 35–37. A1:14 days, accepting 13–15, obtained by subtracting from 50.
Komentarz. Paper 1: no calculator; AA SL formula booklet allowed. Give exact results unless a graph estimate is requested.