Zadanie 1e, Paper 2, maj 2024, TZ1, Biologia IB SL
Wzorowane na: Biology SL Paper 2, May 2024, TZ1, pytanie 1(e). Treść, dane i kontekst są zmienione; sprawdzane umiejętności, format i punktacja jak w oryginale.
Darmowe konto pozwoli wrócić do niego później.
Zadanie
Wspólne informacje do wiązki zadań
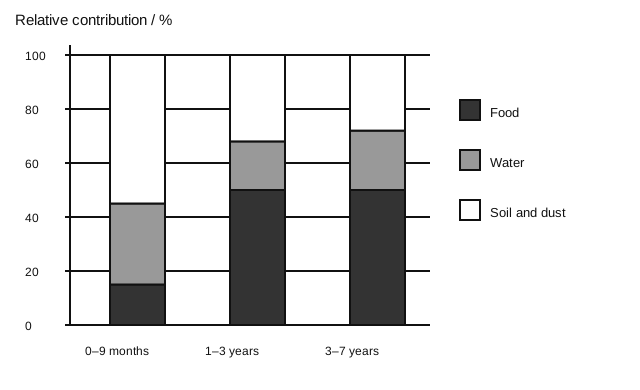
All values and policy dates below are constructed for a data-analysis exercise. Lead exposure can affect development and physiology. Blood lead concentration is used here as an exposure indicator. The first chart estimates contributions from food, water and soil/dust in three age groups.
 Powiększ
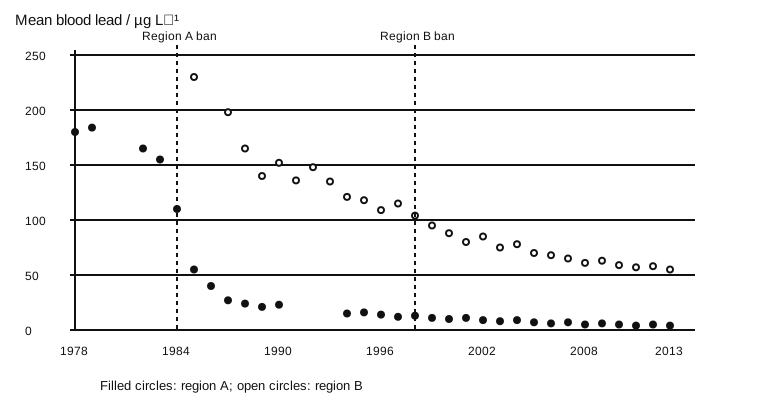
The second dataset follows mean blood lead concentrations among children in two hypothetical regions. Region A removed lead additives from vehicle fuel in 1984; region B did so in 1998.
 Powiększ
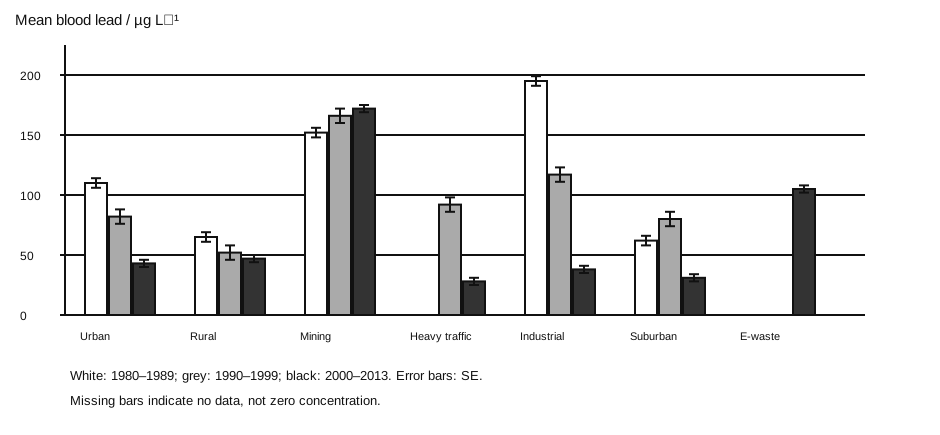
The last chart compares residential environments in region B across three periods. E-waste includes discarded electrical and electronic equipment.
 Powiększ
Polecenie
Compare and contrast the changes in blood lead concentrations after the fuel-policy changes in the two regions.
Korepetytor AI
Nie wiesz, jak ruszyć? Korepetytor zna to zadanie i poprowadzi Cię krok po kroku, bez gotowca.
3 rozmowy · bez karty · Zaloguj się
Sprawdź się
Odpowiedz i oceń, jak poszło. Klucz odsłoń dopiero, gdy masz swoją odpowiedź.
Jak poszło Ci z tym zadaniem?
Wybierz ocenę: zapamięta ją ta przeglądarka, a z darmowym kontem zobaczysz ją na każdym urządzeniu.
Pokaż rozwiązanieUkryj rozwiązanieKlucz i punktacja
Odpowiedź z klucza
Both regions show lower concentrations after their respective policy changes. ✔
The fall in A is sharper; B declines more gradually with several small reversals. ✔
A has lower concentrations than B during their overlapping later observations. ✔
Schemat punktowania
Award 1 for a valid similarity and 1 for a valid difference; maximum 2. Temporal association does not by itself prove causation.