Zadanie 25
Wzorowane na: Chemistry HL Paper 1, May 2023, TZ2, pytanie 25. Treść, dane i kontekst są zmienione; sprawdzane umiejętności, format i punktacja jak w oryginale.
Darmowe konto pozwoli wrócić do niego później.
Polecenie
Which graph represents the pH curve for the titration of a weak acid with a strong base?
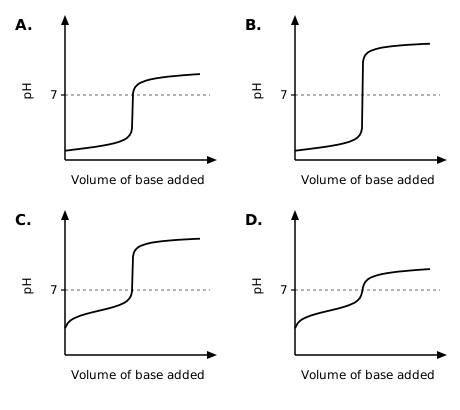
A. Graph A
B. Graph B
C. Graph C
D. Graph D
Sprawdź rozwiązanieUkryj rozwiązanieKlucz i punktacja
Odpowiedź z klucza
C ✔
«a weak acid starts at a higher pH than a strong acid and has a buffer region that rises gradually; the equivalence point lies above pH 7 and, with a strong base, the vertical section is large and the curve levels off at a high pH (graph C). A is a strong acid with a weak base, B is a strong acid with a strong base, and D is a weak acid with a weak base, which has no sharp pH change»
Schemat punktowania
One mark for the correct option.