Zadanie 1c, Paper 2, maj 2023, TZ2, Biologia IB HL
Wzorowane na: Biology HL Paper 2, May 2023, TZ2, pytanie 1(c). Treść, dane i kontekst są zmienione; sprawdzane umiejętności, format i punktacja jak w oryginale.
Darmowe konto pozwoli wrócić do niego później.
Zadanie
Wspólne informacje do wiązki zadań
All numerical results below are constructed for a hypothetical investigation of childhood immunization. Bacteria R and S can cause acute respiratory infection (ARI). The study excludes HIV-infected children when attributing deaths to these pathogens.
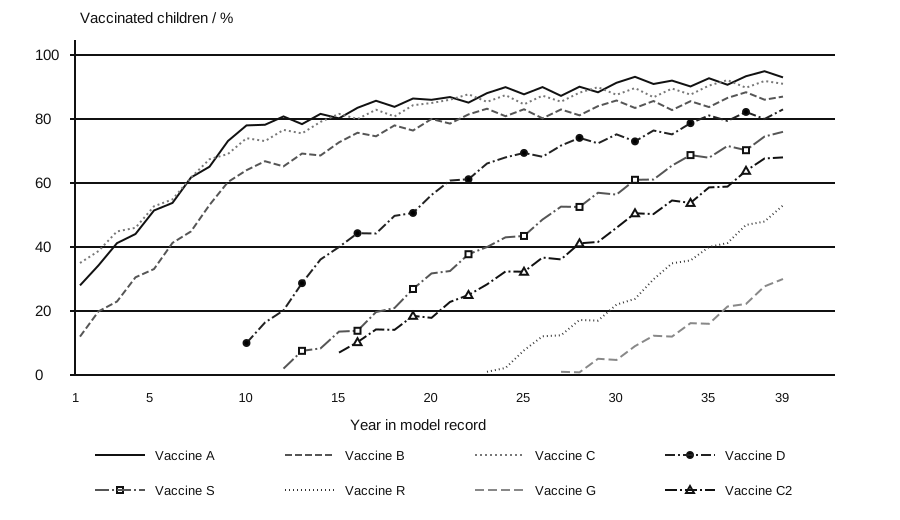
The first chart follows eight vaccine programmes (C and C2 are first- and second-dose programmes for the same pathogen) in the first year of life. R and S label vaccines against the corresponding model bacteria.
 Powiększ
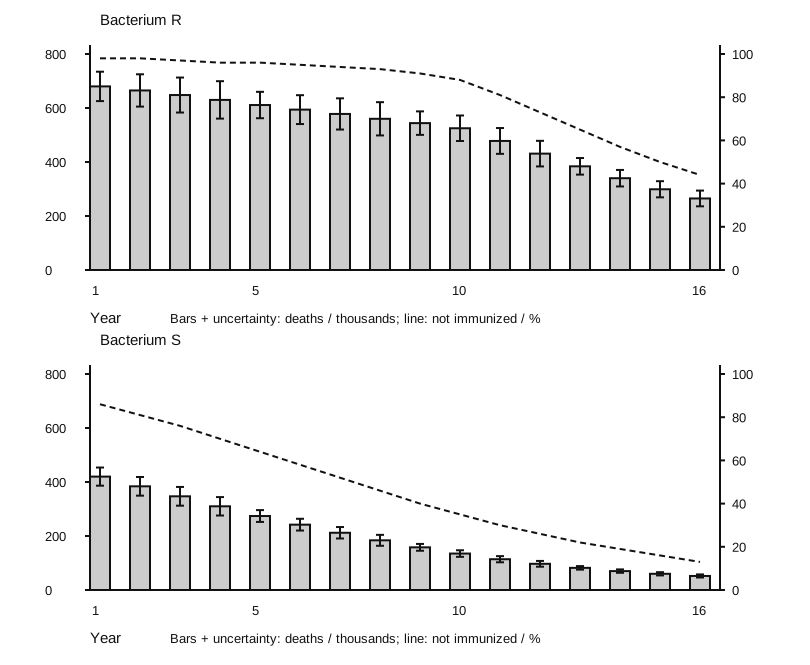
A separate 16-year dataset compares deaths among children younger than five with percentages not immunized against R or S. Each panel uses a left-hand scale for deaths and a right-hand scale for non-immunization.
 Powiększ
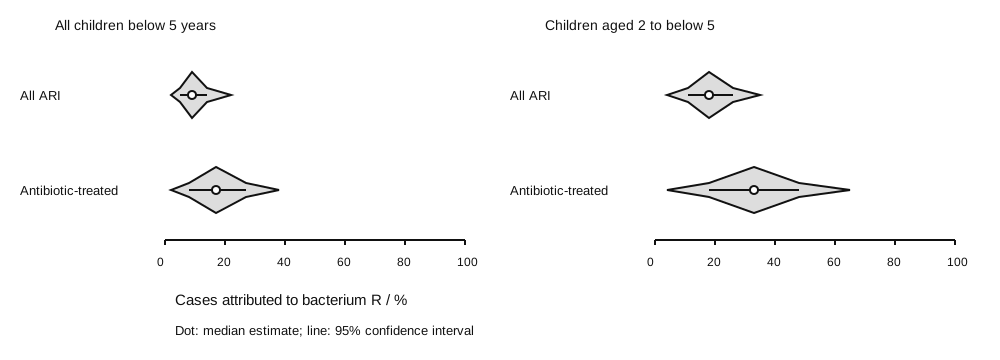
A further analysis estimates the fraction of ARI cases attributable to R, both among all cases and among the subset treated with antibiotics. The age groups overlap: the older group is included in the all-under-five group. Each violin shows an estimate distribution, its median and a 95% confidence interval.
 Powiększ
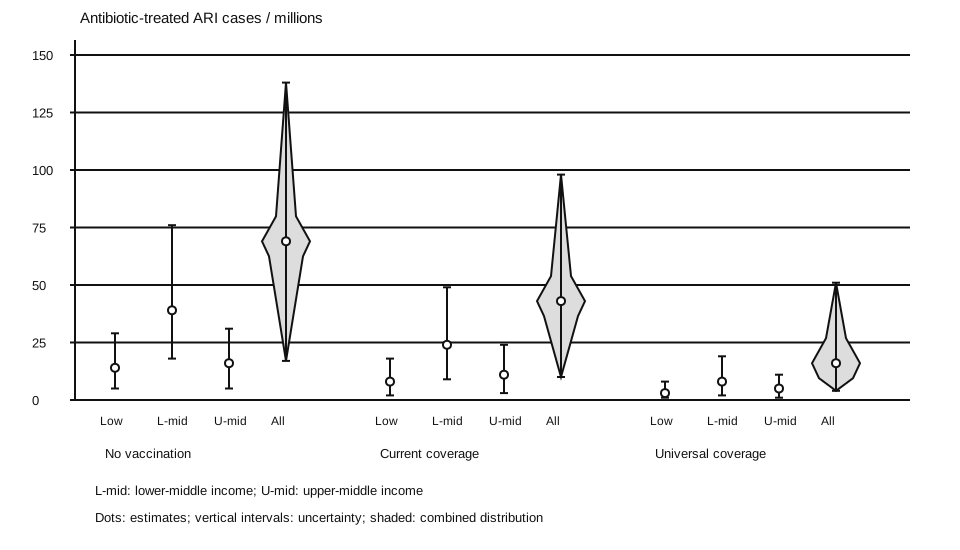
The final chart estimates annual antibiotic-treated ARI cases across three income categories under no vaccination, current coverage and universal vaccination against R. The three income categories together form the combined group.
 Powiększ
Polecenie
Outline conclusions from the panel for bacterium R.
Korepetytor AI
Nie wiesz, jak ruszyć? Korepetytor zna to zadanie i poprowadzi Cię krok po kroku, bez gotowca.
3 rozmowy · bez karty · Zaloguj się
Sprawdź się
Odpowiedz i oceń, jak poszło. Klucz odsłoń dopiero, gdy masz swoją odpowiedź.
Jak poszło Ci z tym zadaniem?
Wybierz ocenę: zapamięta ją ta przeglądarka, a z darmowym kontem zobaczysz ją na każdym urządzeniu.
Pokaż rozwiązanieUkryj rozwiązanieKlucz i punktacja
Odpowiedź z klucza
Both deaths and the percentage not immunized decrease with time. ✔
Deaths are positively associated with non-immunization OR negatively associated with vaccination coverage; the graph supports a protective association. ✔
Deaths decline more rapidly after about year 10. ✔
Substantial numbers of deaths or unvaccinated children remain in year 16. ✔
Schemat punktowania
Award any 2 of the listed points; maximum 2 marks. State comparisons, not only raw values. Do not claim direct proportionality or proven causation from the association alone.