Zadanie 1c
Wzorowane na: Chemistry SL Paper 3, May 2024, TZ1, pytanie 1(c). Treść, dane i kontekst są zmienione; sprawdzane umiejętności, format i punktacja jak w oryginale.
Darmowe konto pozwoli wrócić do niego później.
Informacja do zadań 1a-1c.
A laboratory investigation uses the oxygen released by aqueous hydrogen peroxide to follow its decomposition.
2 H2O2(aq) → 2 H2O(l) + O2(g)
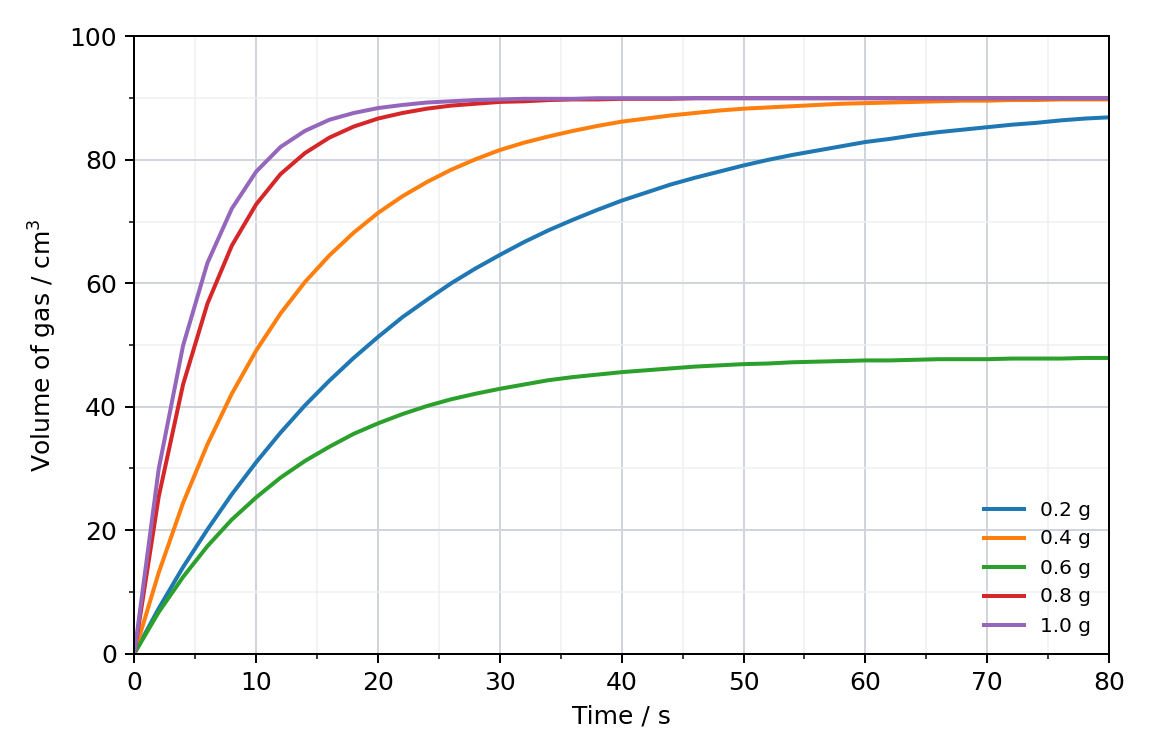
For each run, a weighed portion of copper(II) oxide powder, CuO(s), is mixed with 30.0 cm3 of peroxide solution. A graduated gas syringe collects the oxygen. Readings taken at fixed time intervals give the five curves in Figure 1, each obtained with a different catalyst mass.
Polecenie
The results in Figure 1 were processed to give Figure 2, which shows how the initial rate of reaction varies with the mass of catalyst.
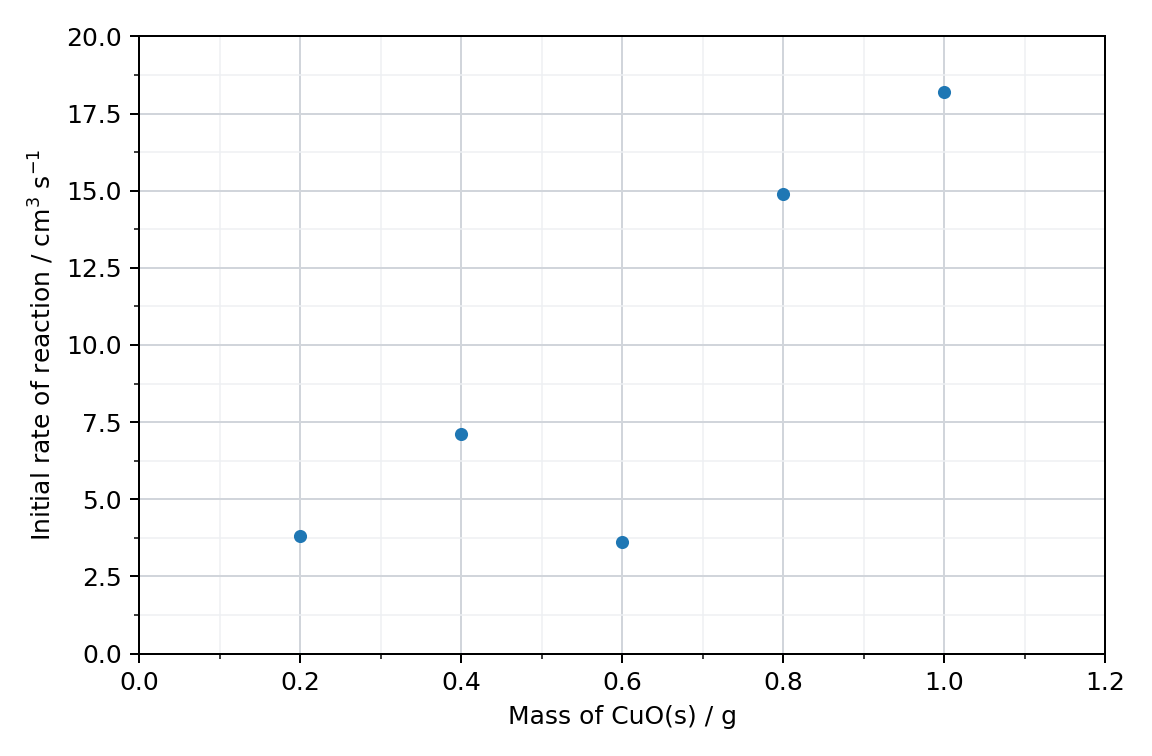
(i) Outline how the y-axis values in Figure 2 were obtained from the results in Figure 1.
(ii) Suggest, giving a reason, whether a best-fit line drawn through the points in Figure 2 should pass through the origin.
Sprawdź rozwiązanieUkryj rozwiązanieKlucz i punktacja
Odpowiedź z klucza
(i) a tangent is drawn to each curve at t = 0 ✔
the gradient «of the tangent» is calculated «change in volume divided by change in time» ✔
(ii) yes AND the rate is «almost» zero when no catalyst is present
OR
no AND the decomposition still occurs, slowly, without a catalyst ✔
Schemat punktowania
M1: tangent at the start of the reaction (accept "at 0 s"); a line joining two points is not enough. M2: gradient calculation; do not accept "taking the derivative" alone. M3: either decision with its matching reason. Do not accept "yes, because the line fits the data better".