Zadanie 1e, Paper 2, maj 2024, TZ2, Biologia IB HL
Wzorowane na: Biology HL Paper 2, May 2024, TZ2, pytanie 1(e). Treść, dane i kontekst są zmienione; sprawdzane umiejętności, format i punktacja jak w oryginale.
Darmowe konto pozwoli wrócić do niego później.
Zadanie
Wspólne informacje do wiązki zadań
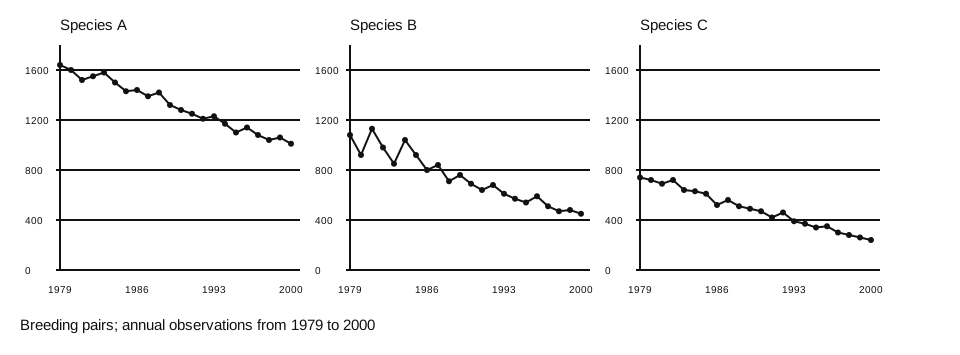
A constructed long-term study follows three hypothetical species of large, long-lived oceanic seabirds, A, B and C. They use wind while searching for prey and breed on the same island. They can be killed accidentally in fishing gear, and changes to food webs or climate may affect them.
The first dataset gives annual breeding-pair counts for 22 years.
 Powiększ
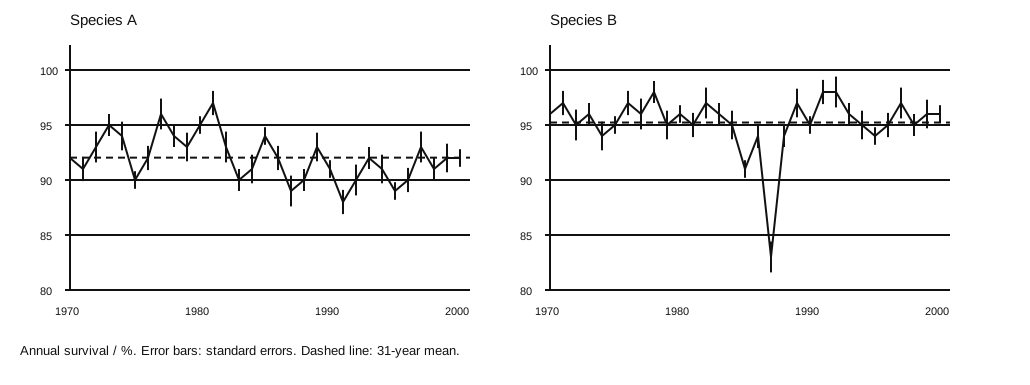
The next dataset gives annual survival for species A and B over 31 years. Annual survival is the percentage of adults alive at the start of a year that remain alive at its end; it excludes recruitment.
 Powiększ
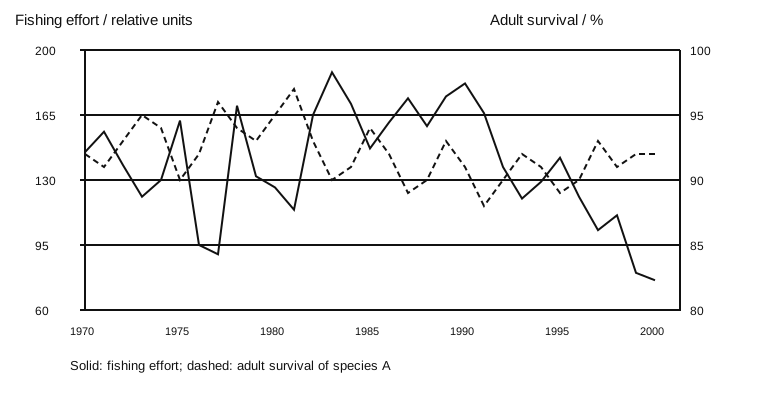
Fishing effort indicates the intensity of fishing activity. The graph pairs it with survival in species A.
 Powiększ
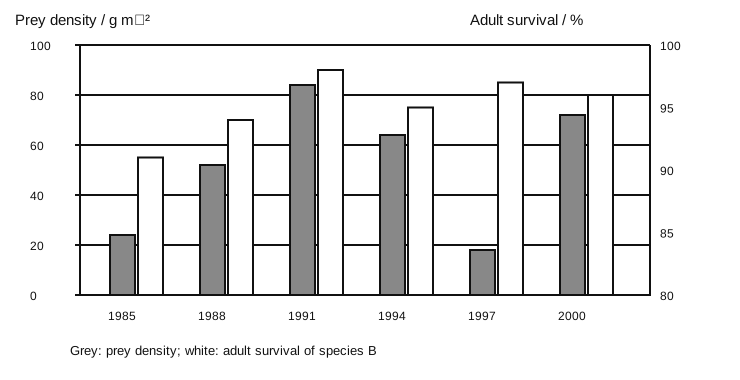
Small crustaceans are important prey directly or indirectly for these birds. The final graph compares prey density and species B survival at six survey dates.
 Powiększ
A further study of species C reports these effects.
| Variable | Total eggs laid in the colony | Percentage of chicks surviving |
|---|---|---|
| Wind conditions depart from the optimum | No significant effect | Negative effect |
| Number of breeding pairs increases | Positive effect | No significant effect |
Polecenie
(i) Calculate the percentage increase in prey density from 1985 to 1991.
(ii) Evaluate whether the record supports dependence of species B survival on prey density, referring to particular intervals.
Korepetytor AI
Nie wiesz, jak ruszyć? Korepetytor zna to zadanie i poprowadzi Cię krok po kroku, bez gotowca.
3 rozmowy · bez karty · Zaloguj się
Sprawdź się
Odpowiedz i oceń, jak poszło. Klucz odsłoń dopiero, gdy masz swoją odpowiedź.
Jak poszło Ci z tym zadaniem?
Wybierz ocenę: zapamięta ją ta przeglądarka, a z darmowym kontem zobaczysz ją na każdym urządzeniu.
Pokaż rozwiązanieUkryj rozwiązanieKlucz i punktacja
Odpowiedź z klucza
(i) (84−24) ÷ 24 × 100 = 250%. ✔
(ii) From 1985 to 1991 both prey density and survival rise, supporting an association. ✔
From 1994 to 1997 prey density falls while survival rises, OR from 1997 to 2000 prey rises while survival falls, contradicting a simple dependence. ✔
Only six survey dates are shown, so the record does not isolate food supply from other influences. ✔
Schemat punktowania
Part (i): 1 for 250%, no working required. Part (ii): any 2 supported evaluation points; a data-based point must identify an interval. Maximum 3.