Zadanie 2b, Paper 2, maj 2026, TZ1, Matematyka AA IB SL
Wzorowane na: Matematyka AA IB SL — maj 2026, TZ1, Paper 2 (zadania wzorowane), pytanie 2(b). Treść, dane i kontekst są zmienione; sprawdzane umiejętności, format i punktacja jak w oryginale.
Darmowe konto pozwoli wrócić do niego później.
Zadanie
Wspólne informacje do wiązki zadań
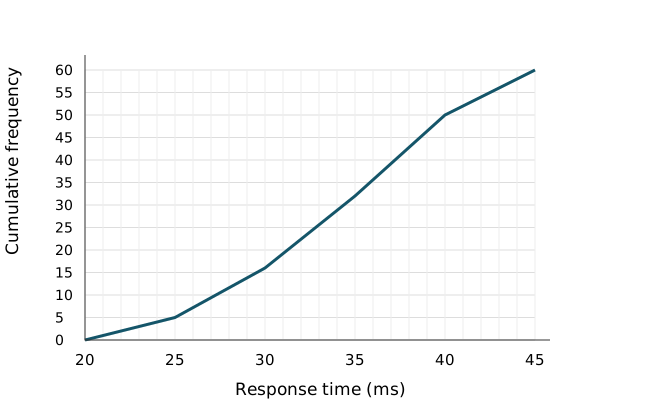
Response times for 60 test requests are summarized by the cumulative-frequency graph. Straight segments join the plotted class-boundary values.
Polecenie
The class frequencies are 5 for 20 ≤ h < 25, 11 for 25 ≤ h < 30, 16 for 30 ≤ h < 35, p for 35 ≤ h < 40 and q for 40 ≤ h < 45.
(i) Find p and q. (ii) Estimate the mean from this table, to four significant figures.
 Powiększ
Korepetytor
Nie wiesz, jak ruszyć? Korepetytor zna to zadanie i poprowadzi Cię krok po kroku, bez gotowca.
3 rozmowy · bez karty · Zaloguj się
Sprawdź się
Jak poszło?
Pokaż rozwiązanieUkryj rozwiązanie
Odpowiedź z klucza
(i) The cumulative values at 35,40,45 are 32,50,60. Thus p=18 and q=10. (ii) Use class midpoints 22.5,27.5,32.5,37.5,42.5. The estimated mean is [5(22.5) + 11(27.5) + 16(32.5) + 18(37.5) + 10(42.5)]/60 = 2035/60 = 33.91666…, so 33.92 ms to four significant figures.
Schemat punktowania
(i) M1: subtract cumulative frequencies at appropriate class boundaries. A1: p=18 and q=10. (ii) M1: use class midpoints. M1: weight their representative values by frequencies and add. A1: 33.92 ms, specifically to four significant figures.
Komentarz. Paper 2: graphic display calculator and AA SL formula booklet allowed. Give exact results or three significant figures unless specified otherwise. Record equations and technology inputs; retain full precision between steps.